The butterfly effect: geographic patterns of DNA barcode variation in subtropical Lepidoptera
Forest dynamics, spatial distribution patterns, and sampling scale are associated with mitochondrial DNA variation in Argentinian butterfliesAndean forests in northwestern Argentina.
PHOTO CREDIT: Ezequiel Núñez Bustos
Argentina harbours more than 1,200 species of butterflies, most of them found in two biodiversity hotspots and priority areas for conservation: the Atlantic Forest and the Andean forests1.

Figure 1: Sampling localities in northwestern Argentina (NWA, black squares) and northeastern Argentina (NEA, white triangles)2. The Atlantic Forest (dark blue) extends along the Brazilian coast and reaches its southernmost portion in NEA, while the Central Andean forests (red) descend from southern Peru and reach NWA. The distribution of eight other ecoregions indicated.
Despite their current isolation (Figure 1), these two areas have been cyclically and transiently connected in the past, promoting the interchange of flora and fauna, and resulting in a pattern of disjunctly co-distributed taxa. While the historical relationship between these allopatric forests and its evolutionary effects on shared fauna has been the subject of recent (and ongoing) research, studies have been concentrated mostly on vertebrates.
This study explores the butterflies of the Atlantic Forest and the Andean forests providing new insights into both the diversification patterns in southern South America and the impact of increasing the geographic and taxonomic scale of sampling on DNA barcoding performance in the region.

In 2017, we assembled and analyzed a DNA barcode reference library for 417 species from northeastern Argentina (NEA)2, focusing on the Atlantic Forest and covering around one-third of the butterfly fauna of the country. To expand the geographic and taxonomic distribution of this library, we generated DNA barcodes for 213 butterfly species from northwestern Argentina (NWA) with a focus on the Andean forests.
We then used these libraries to examine three themes, outlined below.
1.The effectiveness of DNA barcodes for species discrimination and identification
The mean intraspecific distance for the butterflies of NWA was 0.29%, while mean interspecific distance among congeneric species was 7.24% (Figure 2). More importantly, mean distance to the nearest neighbour (7.56%) was nearly 13 times larger than the mean distance to the furthest conspecific (0.60%), resulting in a distinct barcode gap for all but two species represented by two or more individuals (Figure 2).
Genetic distance or sequence variation in the COI sequences within and between species was estimated using the Kimura-2-parameter (K2P) model of nucleotide substitution.
Substitution models† describe the process of genetic variation through fixed mutations, constituting the foundation of evolutionary analysis at the molecular level.
†Arenas M (2015) Trends in substitution models of molecular evolution. Frontiers in Genetics 6(319).

Figure 2: Frequency histogram of COI sequence distances within species (orange) and among congeneric species (blue) of butterflies in NWA. The inset graph shows the barcode gap analysis for species represented by two or more COI sequences, where each dot represents a specimen. Red dots correspond to individuals with a maximum intraspecific distance higher than the distance to the nearest heterospecific. The vertical dashed line shows the 95th percentile of all intraspecific distances (2.02%), while the horizontal line corresponds to the lower 5% of all congeneric distances (3.36%).
Consistently, sequence-based specimen identification simulations showed that this library is extremely effective in the identification of the butterflies of NWA, exceeding a 98% success rate regardless of the identification criteria implemented.
We then used different clustering algorithms to assess the presence of cryptic species. Overall, these methods generated between 1.4–9.9% more Molecular Operational Taxonomic Units (MOTUs) than the number of reference species, suggesting that the butterfly diversity of NWA might be higher than currently recognized.

Figure 3: Taxonomic coverage of the complete DNA barcode reference library for the butterflies of Argentina. Dark shading indicates the proportion of species covered within each family based on the total known for the country.
Merging the NWA and NEA databases resulted in a DNA barcode reference library for nearly 500 butterfly species, covering ~40% of the butterfly fauna of Argentina (Figure 3) and representing 549 barcode clusters (BINs) on BOLD (170 of which are new to the platform).
2.The impact of increasing the spatial and taxonomic coverage on DNA barcoding performance
When we compared the two reference libraries, we found that the barcode gap was significantly narrower in the NEA than in the NWA library (Figure 4). This is most likely associated with the higher geographic and taxonomic coverage of the former, since expanding the spatial scale of sampling is expected to not only increase intraspecific variation as a result of isolation by distance but also reduce interspecific divergences as more closely related species appear.

Figure 4: Maximum intraspecific distance (blue) and minimum interspecific distance (red) for the three datasets. Note the different scales.
When we tried to identify specimens from NWA by using the reference library of NEA, a considerably high proportion of individuals representing shared species between these regions could not be identified or resulted in an ambiguous identification, even when we allowed a maximum intraspecific distance of as high as 2% in the identification procedure. This was due to the existence of deep intraspecific divergences between conspecifics from northeastern and northwestern Argentina, two regions separated on average by more than 1,000 km.
At the same time, however, we observed that the effect of increasing the geographic (and taxonomic) scale was more profound on the minimum interspecific distances than on the maximum intraspecific distances. Therefore, it is possible that butterfly species in NEA are also naturally more variable than in NWA based on our current sampling. While specimens from NWA came almost exclusively from the montane forest on the east slope of the Andes, the sampling in NEA covered not only larger geographic distances but also a more heterogeneous landscape, characterized by the existence of different ecoregions (Figure 1) and physical barriers such as river, specifically the Paraná-Paraguay River axis. Regardless, our results show that both large geographic distances and increased taxonomic coverage can affect DNA barcoding identification performance, especially when using a local library to identify the fauna from another distant region.
As expected, the maximum intraspecific distance was significantly higher and minimum interspecific distance was significantly lower in the complete database (NEA + NWA) than within the NWA and NEA libraries alone (Figure 4). However, the logical and anticipated reduction in the barcode gap did not have, in this case, a significant impact on the identification performance of DNA barcodes, which were able to correctly identify ~99% of the individuals. This reflects the importance of increasing the spatial and taxonomic coverage of DNA barcode libraries to improve identification success, and of considering the use of a local database to identify regional fauna when a more comprehensive COI database is not available.
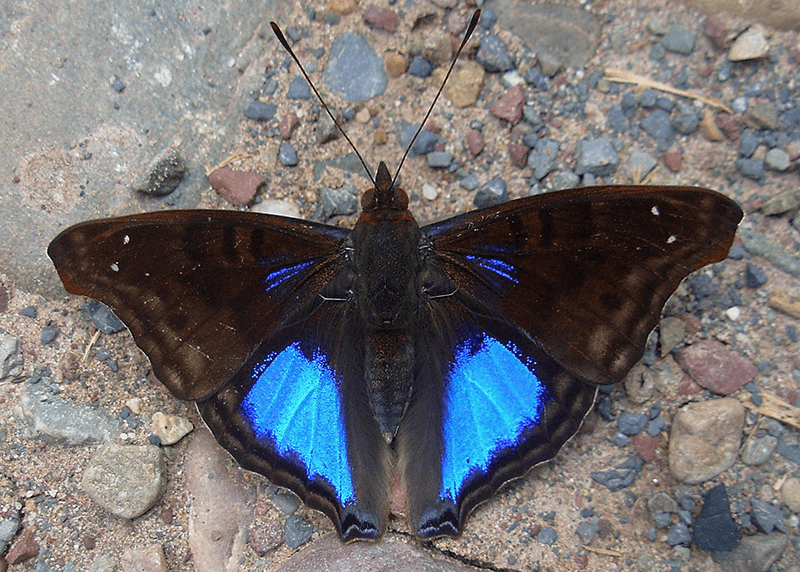
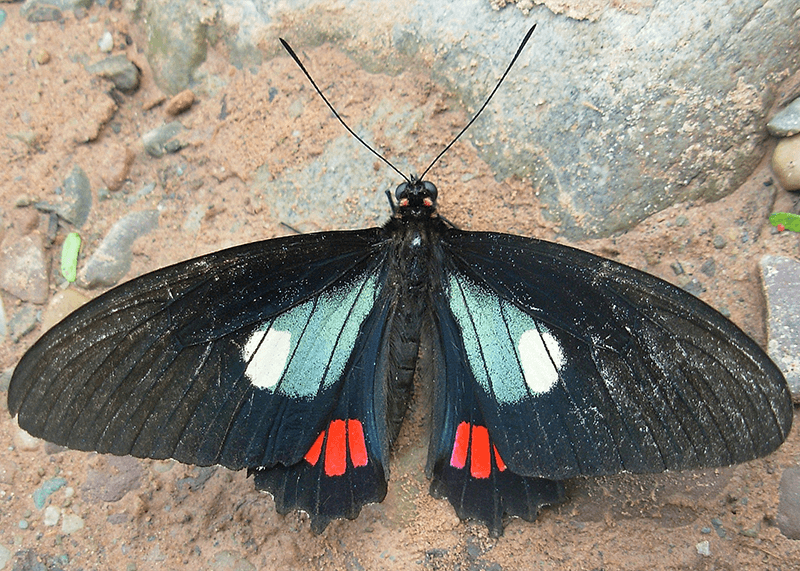
Parides erithalion erlaces
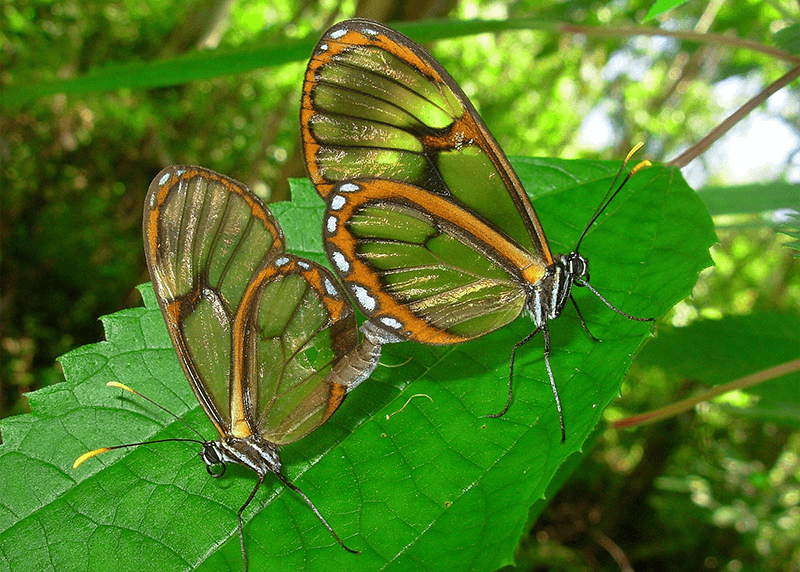
Pteronymia ozia tanampaya
Butterfly species from the Andean forests. PHOTO CREDIT: Ezequiel Núñez Bustos
3.Geographic patterns of intraspecific variation across Argentina
A total of 135 butterfly species are shared between the databases of NEA and NWA. Mean intraspecific distance for these species was significantly higher between regions (1.02%) than within them (NEA, mean 0.35%; NWA, mean 0.33%), especially for a subset of 43 species that showed particularly deeper distance (mean 2.43%) between NEA and NWA.
We then focused only on the 85 species that are present in both the Atlantic Forest and the Andean forests (Figure 5), 27 of which have a disjunct distribution between forests, being absent from intermediate ecoregions, while the remaining 57 have a continuous range across northern Argentina.

Figure 5: Proportion of shared species between NEA and NWA that occur in both forests. The spatial distribution pattern (disjunct vs continuous) and the percentage of species with a deep intraspecific divergence between forest populations indicated.
We found that mean intraspecific distance between forest populations was significantly higher for the disjunctly distributed species (1.65%) than for species with continuous ranges (0.78%), showing that spatial distribution patterns have an influence on the level of intraspecific variation. Moreover, the proportion of species showing the deep divergence between populations from the Atlantic Forest and the Andean forests was notably higher among species with fragmented distributions (nearly 50%) than for species with continuous ranges (less than 30%) (Figure 5).
Lastly, based on standard molecular rates and COI sequence divergence, all diversification events between forest populations were dated to the last two million years, a time period when the currently isolated Atlantic Forest and Andean forests experienced multiple transient connections across the open vegetation corridor, a diagonal of more open and drier savanna-like environments (Caatinga, Cerrado and Chaco) that isolates the Atlantic Forest from the Andean forests (and the adjacent Amazonia) (Figure 1). These past connections were promoted mainly by Pleistocene climatic changes and habitat shifts.
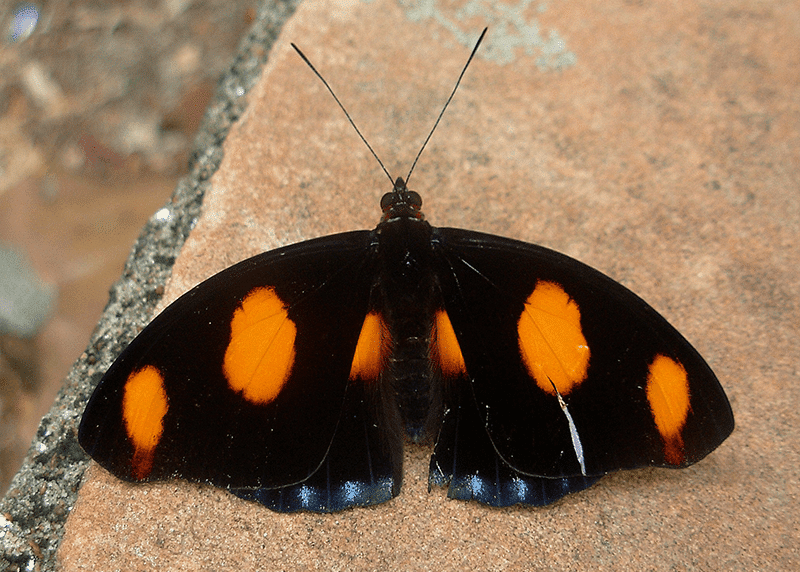
Catonephele numilia neogermanica
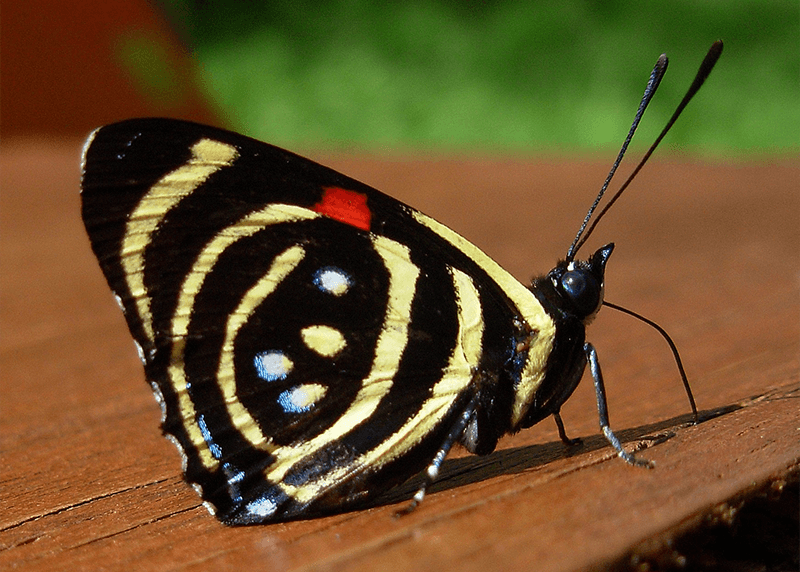
Callicore hydaspes
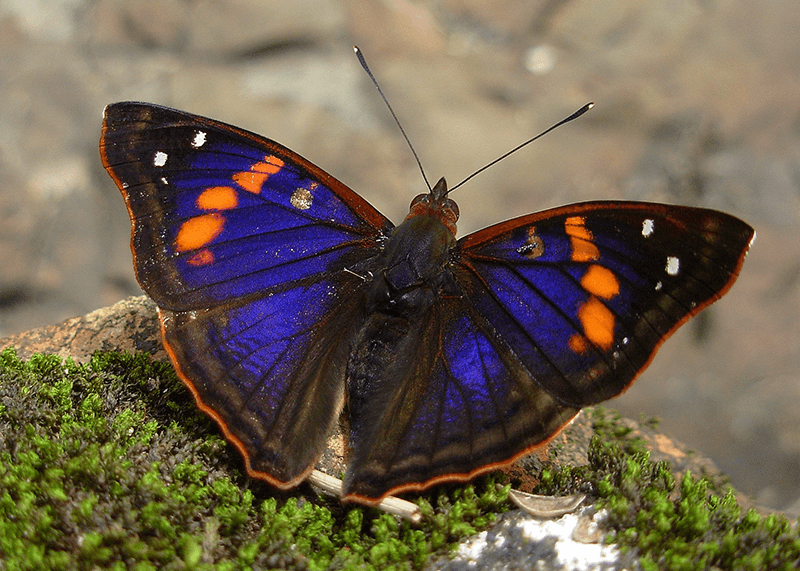
Doxocopa agathina vacuna
Butterfly species from the Atlantic Forest.
PHOTO CREDIT: Ezequiel Núñez Bustos
Conclusions
Our study has not only expanded the DNA barcode reference library for the butterflies of Argentina, but it also constitutes, to our knowledge, the first multi-species assessment of the historical relationship between the currently isolated Atlantic Forest and Andean forests using butterfly species as model organisms.
Importantly, our research supports the fact that, even in the era of genomic data, large-scale analyses of mitochondrial DNA variation are still extremely useful for evolutionary studies, as they unveil spatial diversification patterns and highlight cases that deserve further investigation.
ACKNOWLEDGEMENTS:
We thank our colleagues from the Museo Argentino de Ciencias Naturales and the staff at the Centre for Biodiversity Genomics (CBG) for their help during different stages of this ongoing investigation. We also thank Michelle D’Souza for her helpful comments and suggestions that improved this contribution. This project is supported by Richard Lounsbery Foundation, the CBG, the Consejo Nacional de Investigaciones Científicas y Técnicas (CONICET), the Agencia Nacional de Promoción de la Investigación, el Desarrollo Tecnológico y la Innovación, Fundación Williams, Fundación Bosques Nativos Argentinos and Fundación Temaiken. For granting the permits and transit guides, we thank the Offices of Fauna of the Argentinian provinces in which fieldwork was conducted, the Administración de Parques Nacionales, and the Ministerio de Ambiente y Desarrollo Sostenible from Argentina.
References:
1. Klimaitis J, Núñez Bustos E, Klimaitis C, Güller R (2018) Mariposas-Butterflies-Argentina. Guía de Identificación-Identification Guide. Vazquez Mazzini Editores. Buenos Aires. pp. 327.
2. Lavinia P, Núñez Bustos E, Kopuchian C, Lijtmaer D, García N, Hebert P, Tubaro P (2017) Barcoding the butterflies of southern South America: Species delimitation efficacy, cryptic diversity and geographic patterns of divergence. PLOS ONE 12(10), e0186845. https://dx.doi.org/10.1371/journal.pone.0186845
Written by

Natalí Attiná

Ezequiel Núñez Bustos

Darío A. Lijtmaer

Pablo L. Tubaro

Pablo D. Lavinia
Museo Argentino de Ciencias Naturales “Bernardino Rivadavia” (MACN–CONICET)
doi: 10.21083/ibol.v10i1.6256
Don't Miss Out!
Subscribe to the iBOL Barcode Bulletin for updates on DNA barcoding efforts, the iBOL Consortium, and more.
comment on this article
The Barcode Bulletin moderates comments to promote an informed and courteous conversation. Abusive, profane, self-promotional, or incoherent comments will be rejected.


0 Comments